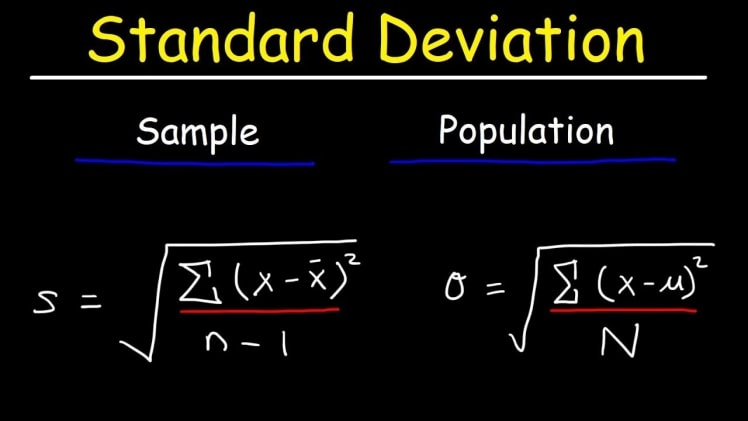
The standard deviation formula is primarily used to estimate the values in a particular data that has been dispersed. In simple language, we can say that the standard deviation is the deviation of the values or data from the pre-determined average mean or simply the mean.
Proximity of Deviation
A lower standard deviation indicates that the values are very close to their average values, while a higher standard deviation will indicate a higher deviation or far from the average mean value. This should be remembered that a standard deviation can never result in a negative number.
What are the Types of Standard Deviation?
The two types of standard deviation are as follows:
- Population Standard Deviation
- Sample Standard Deviation.
What are the Formulae of the Two Types of Standard Deviation?
The formula for Population Standard Deviation is σ=√∑(X−μ)2nσ=∑(X−μ)2n. The Formula for Sample Standard Deviation Formula is s=√∑(X−¯X)2n−1s=∑(X−X¯)2n−1.
Explanation of the Formula
In this section, we will stepwise understand the formula and see how to calculate the standard deviation. We will begin with Step 1:
- Step 1 – First estimate the mean of the data.
- Step 2 – Then take each number and subtract the mean from the number and thereafter square up the result that you get.
- Step 3 – Now, in the next step, you need to see the mean and find the squared difference of the mean. Here, workout will mean that we need to add up all the values which came as a result and then divide by the total number.
- Step 4 – Now estimate the square root of the estimated value.
What are the Important Properties of Standard Deviation?
There are many important standard deviation properties. Some properties are listed as under:
- Standard Deviation cannot be negative in terms.
- Standard Deviation is the measure of the spread or the dispersion of the data around the mean.
- The standard deviation is the representation of the variation that happens from the main data.
- The standard deviation is very much sensitive to the outlying data. If it senses any minute change or dispersion from the main data, then it will show in its results.
- Even with a similar mean, the greater spread in data indicates a greater standard deviation.
How Is Standard Deviation Different from Variance?
Standard Deviation and Variance are the basic mathematical concepts that of course have a very important place in the real-life, especially in the financial sector. The Standard Deviation is applied in various fields like in the field of accounting, investments as well as in economics and investing
Standard Deviation and Variance measures the variability of the data using their respective set of mean. Also, there are some differences between the two. The standard deviation will measure the square root of the variance data while the variance is the average of every point from the mean value.
Cuemath Website – For the Best Maths Learning Experience
Want to score high marks in maths? Want to be a Maths wizard? Then you must visit the Cuemath website to access their online classes. The classes are curated in a manner that will be very much beneficial for the students to understand the subject conceptually.
To score good marks in any subject, proper guidance is the utmost. Thus, in maths, the same is to be applied. The students are required to have a good conceptual understanding, and this is possible only with proper guidance. Cuemath provides a whole range of mathematical studies with brilliant understanding content. Not only this, there are a series of exercises and worksheets which are to be practiced by the students so that they can perform their best in the exam.
Like, this concept was based on Standard Deviation and the formula of the Standard Deviation. The formula of the standard deviation can be understood well after many practices.
If you want to study other concepts as well, visit Cuemath.

